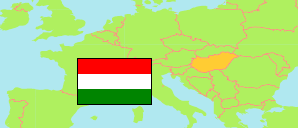
Komárom-Esztergom
County in Hungary
Contents: Subdivision
The population development in Komárom-Esztergom as well as related information and services (Wikipedia, Google, images).
| Name | Status | Population Census 1980-01-01 | Population Census 1990-01-01 | Population Census 2001-02-01 | Population Census 2011-10-01 | Population Census 2022-10-01 | |
|---|---|---|---|---|---|---|---|
| Komárom-Esztergom | County | 322,893 | 316,984 | 316,590 | 304,568 | 300,631 | |
| Esztergom | District | 98,417 | 95,637 | 96,002 | 93,784 | 92,337 | → |
| Kisbér | District | 23,454 | 21,937 | 21,412 | 20,284 | 19,594 | → |
| Komárom | District | 42,661 | 41,050 | 41,346 | 39,863 | 38,457 | → |
| Oroszlány | District | 28,486 | 28,770 | 28,220 | 26,163 | 25,822 | → |
| Tata | District | 38,979 | 39,589 | 39,784 | 38,783 | 39,436 | → |
| Tatabánya | District | 90,896 | 90,001 | 89,826 | 85,691 | 84,985 | → |
| Magyarország [Hungary] | Country | 10,709,463 | 10,374,823 | 10,198,315 | 9,937,628 | 9,603,634 |
Source: Hungarian Central Statistical Office.
Explanation: 2022 census results are final.
Further information about the population structure:
| Gender (C 2022) | |
|---|---|
| Males | 145,424 |
| Females | 155,207 |
| Age Groups (C 2022) | |
|---|---|
| 0-17 years | 53,027 |
| 18-64 years | 187,695 |
| 65+ years | 59,909 |
| Age Distribution (C 2022) | |
|---|---|
| 90+ years | 1,410 |
| 80-89 years | 11,508 |
| 70-79 years | 26,493 |
| 60-69 years | 38,734 |
| 50-59 years | 40,946 |
| 40-49 years | 50,214 |
| 30-39 years | 39,328 |
| 20-29 years | 33,105 |
| 10-19 years | 29,704 |
| 0-9 years | 29,189 |