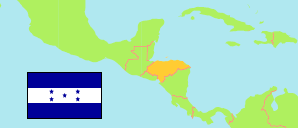
Yoro
Department in Honduras
Contents: Subdivision
The population development in Yoro as well as related information and services (Wikipedia, Google, images).
| Name | Status | Population Census 2001-07-28 | Population Census 2013-08-10 | Population Projection 2023-07-01 | |
|---|---|---|---|---|---|
| Yoro | Department | 465,414 | 570,595 | 655,445 | |
| Arenal | Municipality | 5,139 | 5,949 | 6,080 | → |
| El Negrito | Municipality | 37,095 | 45,363 | 50,550 | → |
| El Progreso | Municipality | 157,188 | 188,366 | 204,420 | → |
| Jocón | Municipality | 7,743 | 9,591 | 9,752 | → |
| Morazán | Municipality | 34,052 | 40,402 | 50,930 | → |
| Olanchito | Municipality | 83,749 | 104,609 | 124,286 | → |
| Santa Rita | Municipality | 18,666 | 20,301 | 21,536 | → |
| Sulaco | Municipality | 13,858 | 17,509 | 20,916 | → |
| Victoria | Municipality | 26,678 | 33,019 | 39,095 | → |
| Yorito | Municipality | 13,412 | 18,823 | 24,398 | → |
| Yoro | Municipality | 67,834 | 86,665 | 103,481 | → |
| Honduras | Republic | 6,535,344 | 8,303,771 | 9,745,149 |
Source: Instituto Nacional de Estadística Honduras (web).
Explanation: All population figures are adjusted for underenumeration.
Further information about the population structure:
| Gender (P 2023) | |
|---|---|
| Males | 319,906 |
| Females | 335,539 |
| Age Groups (P 2023) | |
|---|---|
| 0-14 years | 203,639 |
| 15-64 years | 407,956 |
| 65+ years | 43,850 |
| Age Distribution (P 2023) | |
|---|---|
| 80+ years | 10,037 |
| 70-79 years | 19,419 |
| 60-69 years | 32,042 |
| 50-59 years | 46,195 |
| 40-49 years | 65,485 |
| 30-39 years | 92,963 |
| 20-29 years | 118,904 |
| 10-19 years | 135,039 |
| 0-9 years | 135,361 |
| Urbanization (P 2023) | |
|---|---|
| Rural | 300,968 |
| Urban | 354,477 |
| Place of Birth (C 2013) | |
|---|---|
| Same municipality | 448,920 |
| Other municipality in Honduras | 119,992 |
| Other country | 1,683 |
| Ethnic Group (C 2013) | |
|---|---|
| Indigenous | 25,682 |
| Non-Indigenous | 544,912 |