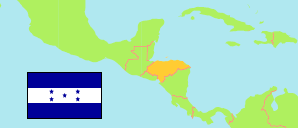
Santa Bárbara
Department in Honduras
Contents: Subdivision
The population development in Santa Bárbara as well as related information and services (Wikipedia, Google, images).
| Name | Status | Population Census 2001-07-28 | Population Census 2013-08-10 | Population Projection 2023-07-01 | |
|---|---|---|---|---|---|
| Santa Bárbara | Department | 342,054 | 421,337 | 490,072 | |
| Arada | Municipality | 8,110 | 9,622 | 11,746 | → |
| Atima | Municipality | 12,178 | 17,648 | 21,372 | → |
| Azacualpa | Municipality | 17,178 | 20,210 | 25,920 | → |
| Ceguaca | Municipality | 4,075 | 4,948 | 5,964 | → |
| Chinda | Municipality | 4,329 | 4,702 | 5,280 | → |
| Concepción del Norte | Municipality | 7,893 | 8,989 | 9,947 | → |
| Concepción del Sur | Municipality | 5,862 | 5,486 | 5,484 | → |
| El Níspero | Municipality | 6,610 | 8,109 | 9,748 | → |
| Gualala | Municipality | 4,894 | 5,191 | 5,703 | → |
| Ilama | Municipality | 8,729 | 9,058 | 9,280 | → |
| Las Vegas | Municipality | 18,188 | 23,980 | 27,831 | → |
| Macuelizo | Municipality | 26,919 | 34,401 | 39,722 | → |
| Naranjito | Municipality | 10,256 | 11,901 | 13,769 | → |
| Nueva Frontera | Municipality | 12,989 | 13,069 | 14,117 | → |
| Nuevo Celilac | Municipality | 6,701 | 8,086 | 8,236 | → |
| Petoa | Municipality | 9,942 | 12,135 | 13,212 | → |
| Protección | Municipality | 13,813 | 16,374 | 18,338 | → |
| Quimistán | Municipality | 31,213 | 47,993 | 65,727 | → |
| San Francisco de Ojuera | Municipality | 5,613 | 7,000 | 8,504 | → |
| San José de Colinas | Municipality | 17,013 | 18,791 | 20,070 | → |
| San Luis | Municipality | 24,134 | 24,606 | 25,835 | → |
| San Marcos | Municipality | 13,253 | 15,229 | 16,608 | → |
| San Nicolás | Municipality | 10,999 | 14,368 | 16,768 | → |
| San Pedro Zacapa | Municipality | 8,765 | 10,535 | 11,243 | → |
| Santa Bárbara | Municipality | 30,263 | 41,736 | 49,747 | → |
| Santa Rita | Municipality | 3,319 | 3,975 | 4,136 | → |
| San Vicente Centenario | Municipality | 2,593 | 3,601 | 3,875 | → |
| Trinidad | Municipality | 16,223 | 19,593 | 21,890 | → |
| Honduras | Republic | 6,535,344 | 8,303,771 | 9,745,149 |
Source: Instituto Nacional de Estadística Honduras (web).
Explanation: All population figures are adjusted for underenumeration.
Further information about the population structure:
| Gender (P 2023) | |
|---|---|
| Males | 247,652 |
| Females | 242,420 |
| Age Groups (P 2023) | |
|---|---|
| 0-14 years | 149,235 |
| 15-64 years | 306,295 |
| 65+ years | 34,544 |
| Age Distribution (P 2023) | |
|---|---|
| 80+ years | 8,030 |
| 70-79 years | 15,194 |
| 60-69 years | 25,167 |
| 50-59 years | 36,319 |
| 40-49 years | 50,163 |
| 30-39 years | 69,255 |
| 20-29 years | 88,229 |
| 10-19 years | 98,539 |
| 0-9 years | 99,178 |
| Urbanization (P 2023) | |
|---|---|
| Rural | 318,801 |
| Urban | 171,271 |
| Place of Birth (C 2013) | |
|---|---|
| Same municipality | 328,110 |
| Other municipality in Honduras | 92,278 |
| Other country | 946 |
| Ethnic Group (C 2013) | |
|---|---|
| Indigenous | 11,969 |
| Non-Indigenous | 409,369 |