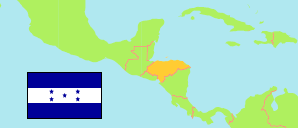
Lempira
Department in Honduras
Contents: Subdivision
The population development in Lempira as well as related information and services (Wikipedia, Google, images).
| Name | Status | Population Census 2001-07-28 | Population Census 2013-08-10 | Population Projection 2023-07-01 | |
|---|---|---|---|---|---|
| Lempira | Department | 250,067 | 321,179 | 382,378 | |
| Belén | Municipality | 4,444 | 6,801 | 9,278 | → |
| Candelaria | Municipality | 6,142 | 6,772 | 7,086 | → |
| Cololaca | Municipality | 5,532 | 8,532 | 11,731 | → |
| Erandique | Municipality | 11,702 | 15,242 | 17,046 | → |
| Gracias | Municipality | 32,151 | 47,622 | 61,421 | → |
| Gualcince | Municipality | 9,539 | 11,295 | 12,529 | → |
| Guarita | Municipality | 7,965 | 8,378 | 9,081 | → |
| La Campa | Municipality | 4,239 | 6,515 | 8,927 | → |
| La Iguala | Municipality | 18,046 | 25,491 | 32,602 | → |
| Las Flores | Municipality | 7,510 | 9,512 | 11,138 | → |
| La Unión | Municipality | 9,799 | 12,526 | 15,834 | → |
| La Virtud | Municipality | 6,133 | 6,583 | 6,743 | → |
| Lepaera | Municipality | 29,120 | 36,720 | 42,187 | → |
| Mapulaca | Municipality | 3,866 | 4,261 | 4,458 | → |
| Piraera | Municipality | 11,422 | 13,758 | 15,478 | → |
| San Andrés | Municipality | 10,473 | 13,151 | 15,300 | → |
| San Francisco | Municipality | 8,087 | 9,017 | 9,517 | → |
| San Juan Guarita | Municipality | 2,842 | 2,650 | 2,834 | → |
| San Manuel Colohete | Municipality | 10,908 | 14,063 | 16,708 | → |
| San Marcos de Caiquín | Municipality | 4,137 | 5,571 | 6,860 | → |
| San Rafael | Municipality | 10,469 | 13,410 | 15,057 | → |
| San Sebastián | Municipality | 8,026 | 10,453 | 12,528 | → |
| Santa Cruz | Municipality | 4,930 | 6,770 | 8,468 | → |
| Talgua | Municipality | 8,400 | 10,420 | 12,001 | → |
| Tambla | Municipality | 2,314 | 3,089 | 3,779 | → |
| Tomalá | Municipality | 5,302 | 6,335 | 7,078 | → |
| Valladolid | Municipality | 3,646 | 3,696 | 3,985 | → |
| Virginia | Municipality | 2,734 | 2,548 | 2,724 | → |
| Honduras | Republic | 6,535,344 | 8,303,771 | 9,745,149 |
Source: Instituto Nacional de Estadística Honduras (web).
Explanation: All population figures are adjusted for underenumeration.
Further information about the population structure:
| Gender (P 2023) | |
|---|---|
| Males | 191,014 |
| Females | 191,364 |
| Age Groups (P 2023) | |
|---|---|
| 0-14 years | 125,920 |
| 15-64 years | 235,861 |
| 65+ years | 20,597 |
| Age Distribution (P 2023) | |
|---|---|
| 80+ years | 4,481 |
| 70-79 years | 9,091 |
| 60-69 years | 15,856 |
| 50-59 years | 23,970 |
| 40-49 years | 35,658 |
| 30-39 years | 54,181 |
| 20-29 years | 72,988 |
| 10-19 years | 82,213 |
| 0-9 years | 83,940 |
| Urbanization (P 2023) | |
|---|---|
| Rural | 340,668 |
| Urban | 41,710 |
| Place of Birth (C 2013) | |
|---|---|
| Same municipality | 287,684 |
| Other municipality in Honduras | 32,565 |
| Other country | 926 |
| Ethnic Group (C 2013) | |
|---|---|
| Indigenous | 147,293 |
| Non-Indigenous | 173,886 |