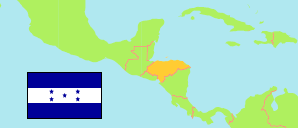
Copán
Department in Honduras
Contents: Subdivision
The population development in Copán as well as related information and services (Wikipedia, Google, images).
| Name | Status | Population Census 2001-07-28 | Population Census 2013-08-10 | Population Projection 2023-07-01 | |
|---|---|---|---|---|---|
| Copán | Department | 288,766 | 371,057 | 430,958 | |
| Cabañas | Municipality | 9,818 | 13,727 | 17,288 | → |
| Concepción | Municipality | 5,625 | 7,720 | 9,848 | → |
| Copán Ruinas | Municipality | 30,703 | 38,109 | 45,312 | → |
| Corquín | Municipality | 10,936 | 16,402 | 20,385 | → |
| Cucuyagua | Municipality | 11,834 | 16,073 | 19,428 | → |
| Dolores | Municipality | 5,006 | 6,420 | 7,652 | → |
| Dulce Nombre | Municipality | 4,807 | 5,671 | 7,240 | → |
| El Paraíso | Municipality | 18,397 | 19,882 | 20,383 | → |
| Florida | Municipality | 26,703 | 28,331 | 30,878 | → |
| La Jigua | Municipality | 7,915 | 9,288 | 10,215 | → |
| La Unión | Municipality | 11,536 | 16,007 | 17,417 | → |
| Nueva Arcadia | Municipality | 30,136 | 40,350 | 47,846 | → |
| San Agustín | Municipality | 3,659 | 5,498 | 6,299 | → |
| San Antonio | Municipality | 9,670 | 9,739 | 10,952 | → |
| San Jerónimo | Municipality | 4,555 | 5,020 | 5,224 | → |
| San José | Municipality | 5,397 | 6,975 | 7,652 | → |
| San Juan de Opoa | Municipality | 7,849 | 9,620 | 9,973 | → |
| San Nicolás | Municipality | 6,017 | 7,553 | 8,932 | → |
| San Pedro de Copán | Municipality | 5,168 | 7,540 | 8,079 | → |
| Santa Rita | Municipality | 24,157 | 29,927 | 33,593 | → |
| Santa Rosa de Copán | Municipality | 40,309 | 61,083 | 74,821 | → |
| Trinidad de Copán | Municipality | 5,817 | 6,865 | 7,817 | → |
| Veracruz | Municipality | 2,752 | 3,259 | 3,727 | → |
| Honduras | Republic | 6,535,344 | 8,303,771 | 9,745,149 |
Source: Instituto Nacional de Estadística Honduras (web).
Explanation: All population figures are adjusted for underenumeration.
Further information about the population structure:
| Gender (P 2023) | |
|---|---|
| Males | 212,226 |
| Females | 218,732 |
| Age Groups (P 2023) | |
|---|---|
| 0-14 years | 134,996 |
| 15-64 years | 270,475 |
| 65+ years | 25,487 |
| Age Distribution (P 2023) | |
|---|---|
| 80+ years | 5,466 |
| 70-79 years | 11,374 |
| 60-69 years | 19,456 |
| 50-59 years | 29,367 |
| 40-49 years | 43,240 |
| 30-39 years | 62,697 |
| 20-29 years | 80,069 |
| 10-19 years | 89,299 |
| 0-9 years | 89,990 |
| Urbanization (P 2023) | |
|---|---|
| Rural | 255,996 |
| Urban | 174,962 |
| Place of Birth (C 2013) | |
|---|---|
| Same municipality | 301,313 |
| Other municipality in Honduras | 67,853 |
| Other country | 1,890 |
| Ethnic Group (C 2013) | |
|---|---|
| Indigenous | 22,997 |
| Non-Indigenous | 348,060 |