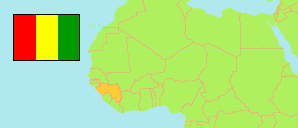
Macenta
Prefecture in Guinea
Contents: Subdivision
The population development in Macenta as well as related information and services (Wikipedia, Google, images).
| Name | Status | Population Census 1996-12-31 | Population Census 2014-03-01 | |
|---|---|---|---|---|
| Macenta | Prefecture | 278,789 | 278,456 | |
| Balizia | Sub-Prefecture | 13,247 | 14,692 | → |
| Binikala | Sub-Prefecture | 14,146 | 17,687 | → |
| Bofossou | Sub-Prefecture | 16,367 | 13,803 | → |
| Daro | Sub-Prefecture | 16,569 | 14,545 | → |
| Fassankoni | Sub-Prefecture | 17,580 | 13,892 | → |
| Kouankan | Sub-Prefecture | 21,910 | 30,225 | → |
| Koyamah | Sub-Prefecture | 33,992 | 25,012 | → |
| Macenta-Centre | Urban Commune | 55,360 | 65,755 | → |
| N'Zébéla | Sub-Prefecture | 14,797 | 16,268 | → |
| Ourémai | Sub-Prefecture | 14,459 | 9,002 | → |
| Panziazou | Sub-Prefecture | 13,956 | 8,440 | → |
| Sengbédou | Sub-Prefecture | 9,860 | 13,764 | → |
| Sérédou | Sub-Prefecture | 26,416 | 20,249 | → |
| Vasérédou | Sub-Prefecture | 6,289 | 8,603 | → |
| Watanka | Sub-Prefecture | 6,381 | 6,519 | → |
| Guinea | Republic | 7,156,406 | 10,523,261 |
Source: Institut National de la Statistique de Guinée (web).
Explanation: The 1996 population of sub-prefectures and urban communes shows slight discrepancies compared to the population of prefectures.
Further information about the population structure:
| Gender (C 2014) | |
|---|---|
| Males | 133,045 |
| Females | 145,411 |
| Age Groups (P 2014) | |
|---|---|
| 0-14 years | 138,493 |
| 15-64 years | 163,761 |
| 65+ years | 12,769 |
| Age Distribution (P 2014) | |
|---|---|
| 0-9 years | 98,346 |
| 10-19 years | 73,154 |
| 20-29 years | 43,444 |
| 30-39 years | 36,116 |
| 40-49 years | 26,731 |
| 50-59 years | 18,469 |
| 60-69 years | 10,791 |
| 70-79 years | 5,591 |
| 80+ years | 2,381 |
| Urbanization (C 2014) | |
|---|---|
| Rural | 219,868 |
| Urban | 58,588 |