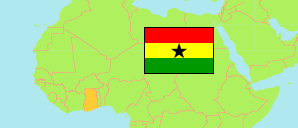
Volta
Region in Ghana
Contents: Subdivision
The population development in Volta as well as related information and services (Wikipedia, Google, images).
| Name | Status | Population Census 2010-09-26 | Population Census 2021-06-27 | |
|---|---|---|---|---|
| Volta | Region | 1,481,363 | 1,659,040 | |
| Adaklu | District | 36,391 | 38,649 | → |
| Afadzato South | District | 95,030 | 73,146 | → |
| Agotime Ziope | District | 28,013 | 39,553 | → |
| Akatsi North | District | 29,777 | 32,541 | → |
| Akatsi South | District | 98,684 | 92,494 | → |
| Anloga (← Keta Municipal) | District | 82,686 | 94,895 | → |
| Central Tongu | District | 59,411 | 83,803 | → |
| Hohoe Municipal | Municipal District | 167,016 | 114,472 | → |
| Ho Municipal | Municipal District | 177,281 | 180,420 | → |
| Ho West | District | 94,600 | 82,886 | → |
| Keta Municipal | Municipal District | 64,932 | 78,862 | → |
| Ketu North Municipal | Municipal District | 99,913 | 114,846 | → |
| Ketu South Municipal | Municipal District | 160,756 | 253,122 | → |
| Kpando Municipal | Municipal District | 53,736 | 58,552 | → |
| North Dayi | District | 39,913 | 39,268 | → |
| North Tongu | District | 89,777 | 110,891 | → |
| South Dayi | District | 46,661 | 57,526 | → |
| South Tongu | District | 87,950 | 113,114 | → |
| Ghana | Republic | 24,658,823 | 30,832,019 |
Source: Ghana Statistical Service (web).
Explanation: Area figures of districts are derived from geospatial data.
Further information about the population structure:
| Gender (C 2021) | |
|---|---|
| Males | 790,685 |
| Females | 868,355 |
| Age Groups (C 2021) | |
|---|---|
| 0-14 years | 562,588 |
| 15-64 years | 983,957 |
| 65+ years | 112,495 |
| Age Distribution (C 2021) | |
|---|---|
| 80+ years | 32,754 |
| 70-79 years | 45,218 |
| 60-69 years | 81,912 |
| 50-59 years | 114,797 |
| 40-49 years | 155,174 |
| 30-39 years | 217,156 |
| 20-29 years | 260,958 |
| 10-19 years | 373,585 |
| 0-9 years | 377,486 |
| Urbanization (C 2021) | |
|---|---|
| Rural | 960,711 |
| Urban | 698,329 |
| Literacy (A11+) (C 2021) | |
|---|---|
| yes | 934,837 |
| no | 305,057 |
| Ethnic Group (C 2021) | |
|---|---|
| Akan | 39,765 |
| Ga-Dangme | 21,537 |
| Ewe | 1,457,474 |
| Guan | 30,514 |
| Gurma | 15,927 |
| Mole-Dagbani | 6,898 |
| Grusi | 1,840 |
| Mandé | 9,382 |
| Other Ethnic Group | 31,582 |