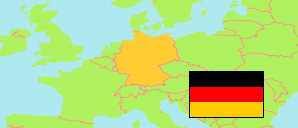
Koblenz
County-level City in Rheinland-Pfalz (Germany)
Contents: Population
The population development of Koblenz as well as related information and services (Wikipedia, Google, images).
| Name | Status | Population Estimate 1990-12-31 | Population Estimate 2001-12-31 | Population Census 2011-05-09 | Population Estimate 2021-12-31 | |
|---|---|---|---|---|---|---|
| Koblenz | County-level City | 108,733 | 107,730 | 107,825 | 113,638 | |
| Deutschland [Germany] | Federal Republic | 79,753,227 | 82,440,309 | 80,219,695 | 83,237,124 |
Source: Statistisches Bundesamt Deutschland, Statistical Offices of the German States.
Explanation: States and counties in the boundaries of 31 December 2022.
Further information about the population structure:
| Gender (E 2021) | |
|---|---|
| Males | 55,693 |
| Females | 57,945 |
| Age Groups (E 2021) | |
|---|---|
| 0-17 years | 17,042 |
| 18-64 years | 71,487 |
| 65+ years | 25,109 |
| Age Distribution (E 2021) | |
|---|---|
| 90+ years | 1,499 |
| 80-89 years | 7,536 |
| 70-79 years | 9,692 |
| 60-69 years | 13,478 |
| 50-59 years | 15,375 |
| 40-49 years | 12,423 |
| 30-39 years | 16,614 |
| 20-29 years | 17,936 |
| 10-19 years | 9,154 |
| 0-9 years | 9,931 |
| Citizenship (E 2021) | |
|---|---|
| German | 96,641 |
| Foreign Citizenship | 16,997 |
| Country of Birth (C 2011) | |
|---|---|
| Germany | 87,555 |
| EU 27 | 5,223 |
| Europe (other) | 6,552 |
| Other country | 6,125 |
| Unknown | 2,370 |
| Religion (C 2011) | |
|---|---|
| Roman Catholic | 56,040 |
| Protestant | 20,312 |
| Other/No/Unknown | 31,473 |