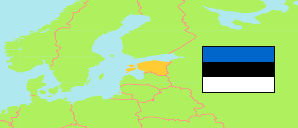
Tallinn
in Tallinn (Harju)
Contents: City
The population development of Tallinn as well as related information and services (weather, Wikipedia, Google, images).
| Name | Municipality | Population Census 2000-03-31 | Population Census 2011-12-31 | Population Census 2021-12-31 | |
|---|---|---|---|---|---|
| Tallinn | Tallinn | 400,150 | 393,222 | 437,817 | → |
Source: Statistical Office of Estonia (web).
Explanation: The area figures of settlements are computed by using geospatial data.
Further information about the population structure:
| Gender (C 2021) | |
|---|---|
| Males | 205,056 |
| Females | 232,761 |
| Age Groups (C 2021) | |
|---|---|
| 0-17 years | 81,762 |
| 18-64 years | 273,008 |
| 65+ years | 83,047 |
| Age Distribution (C 2021) | |
|---|---|
| 90+ years | 3,736 |
| 80-89 years | 21,025 |
| 70-79 years | 34,081 |
| 60-69 years | 49,759 |
| 50-59 years | 51,327 |
| 40-49 years | 64,409 |
| 30-39 years | 78,309 |
| 20-29 years | 46,350 |
| 10-19 years | 42,926 |
| 0-9 years | 45,895 |