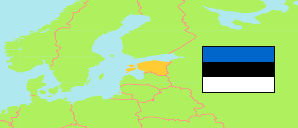
Kambja
Rural Municipality in Estonia
Contents: Population
The population development of Kambja as well as related information and services (Wikipedia, Google, images).
| Name | Status | Population Census 2000-03-31 | Population Census 2011-12-31 | Population Census 2021-12-31 | |
|---|---|---|---|---|---|
| Kambja | Rural Municipality | 7,263 | 10,373 | 12,858 | |
| Eesti [Estonia] | Republic | 1,370,052 | 1,294,455 | 1,331,824 |
Source: Statistical Office of Estonia (web).
Explanation: Counties and municipalities after the administrative reform of 2017.
Further information about the population structure:
| Gender (C 2021) | |
|---|---|
| Males | 6,360 |
| Females | 6,498 |
| Age Groups (C 2021) | |
|---|---|
| 0-17 years | 3,534 |
| 18-64 years | 7,853 |
| 65+ years | 1,471 |
| Age Distribution (C 2021) | |
|---|---|
| 90+ years | 64 |
| 80-89 years | 317 |
| 70-79 years | 562 |
| 60-69 years | 1,090 |
| 50-59 years | 1,435 |
| 40-49 years | 1,962 |
| 30-39 years | 2,331 |
| 20-29 years | 1,265 |
| 10-19 years | 1,757 |
| 0-9 years | 2,072 |
| Citizenship (C 2021) | |
|---|---|
| Estonia | 12,630 |
| Russia | 39 |
| Other Citizenship | 121 |
| Country of Birth (C 2021) | |
|---|---|
| Estonia | 12,403 |
| Russia | 227 |
| Other Country | 229 |
| First Language (C 2021) | |
|---|---|
| Estonian | 12,232 |
| Russian | 471 |
| Other Language | 119 |
| Ethnic Group (C 2021) | |
|---|---|
| Estonians | 12,233 |
| Russians | 390 |
| Other Ethnic Group | 210 |
| Religion (C 2011) | |
|---|---|
| Lutheran | 993 |
| Orthodox | 285 |
| Other Religion | 156 |
| No Religion | 5,283 |