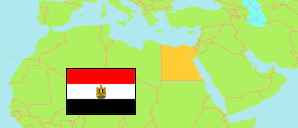
Sawhāj
Governorate in Egypt
Contents: Subdivision
The population development in Sawhāj as well as related information and services (Wikipedia, Google, images).
| Name | Status | Native | Population Census 1996-11-19 | Population Census 2006-11-11 | Population Census 2017-03-28 | Population Estimate 2023-07-01 | |
|---|---|---|---|---|---|---|---|
| Sawhāj [Sohag] | Governorate | سوهاج | 3,123,114 | 3,747,289 | 4,967,409 | 5,727,271 | |
| Akhmīm | Markaz | مركز أخميم | 248,191 | 301,294 | 436,619 | 503,797 | → |
| Al-Balyanā [El Balyana] | Markaz | مركز البلينا | 314,696 | 381,900 | 522,154 | 601,589 | → |
| Al-Kawthar | Kism (fully urban) | قسم الكوثر | ... | 3,036 | 4,831 | 5,603 | → |
| Al-Marāghah [El Maragha] | Markaz | مركز المراغة | 256,801 | 303,161 | 392,060 | 451,722 | → |
| Al-Munsha'āh | Markaz | مركز المنشأة | ... | 313,400 | 401,788 | 463,206 | → |
| Al-'Usayrāt [Aserat] | Markaz | مركز العسيرات | ... | 138,580 | 194,862 | 224,298 | → |
| Dar as-Salām [Dar el-Salam] | Markaz | مركز دار السلام | 255,235 | 308,281 | 409,269 | 471,398 | → |
| Jirjā [Girga] | Kism (urban and rural parts) | قسم جرجا | 95,368 | 108,007 | 145,884 | 169,144 | → |
| Jirjā [Girga] | Markaz | مركز جرجا | ... | 263,850 | 330,020 | 379,869 | → |
| Juhaynah al-Gharbiyah [Juhaynah West] | Markaz | مركز جهينة الغربية | 167,839 | 200,209 | 271,128 | 312,706 | → |
| Madīnat Akhmīm al-Jadīdah [New Akhmim] | New City | مدينة أخميم الجديدة | 0 | 0 | 0 | ... | → |
| Madīnat Sawhāj al-Jadīdah [New Sohag] | New City | مدينة سوهاج الجديدة | 0 | 57 | 174 | 201 | → |
| Sāqultah [Sakulta] | Markaz | مركز ساقلته | 134,839 | 160,809 | 206,296 | 237,732 | → |
| Sawhāj [Sohag] | Markaz | مركز سوهاج | 320,945 | 397,200 | 533,950 | 614,601 | → |
| Sawhāj 1 [Sohag] | Kism (fully urban) | قسم اول سوهاج | 107,645 | 111,921 | 131,267 | 152,291 | → |
| Sawhāj 2 [Sohag] | Kism (fully urban) | قسم ثان سوهاج | 62,772 | 78,211 | 108,721 | 126,134 | → |
| Ṭahṭā | Kism (urban and rural parts) | قسم طهطا | 97,526 | 111,867 | 164,060 | 189,932 | → |
| Ṭahṭā | Markaz | مركز طهطا | 208,189 | 244,878 | 287,736 | 331,199 | → |
| Ṭimā | Markaz | مركز طما | 271,454 | 320,628 | 426,590 | 491,849 | → |
| Miṣr [Egypt] | Republic | مِصر | 59,276,672 | 72,798,031 | 94,798,827 | 105,174,090 |
Source: Central Agency for Public Mobilization and Statistics (CAPMAS), Egypt.
Explanation: Some figures for 2006 are computed using preliminary census results. Area figures of districts are derived from geospatial data.
Further information about the population structure:
| Gender (E 2023) | |
|---|---|
| Males | 2,958,512 |
| Females | 2,768,759 |
| Age Groups (C 2017) | |
|---|---|
| 0-14 years | 1,881,469 |
| 15-64 years | 2,901,907 |
| 65+ years | 184,033 |
| Age Distribution (C 2017) | |
|---|---|
| 90+ years | 4,677 |
| 80-89 years | 25,624 |
| 70-79 years | 77,281 |
| 60-69 years | 194,019 |
| 50-59 years | 325,909 |
| 40-49 years | 425,950 |
| 30-39 years | 636,886 |
| 20-29 years | 877,783 |
| 10-19 years | 1,024,880 |
| 0-9 years | 1,374,400 |
| Urbanization (E 2023) | |
|---|---|
| Rural | 4,504,183 |
| Urban | 1,223,088 |