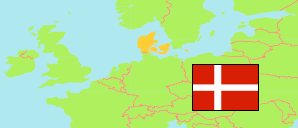
Lejre
Municipality in Sjælland
Municipality
The population development of Lejre.
| Name | Status | Population Estimate 2006-01-01 | Population Estimate 2011-01-01 | Population Estimate 2016-01-01 | Population Estimate 2021-01-01 | Population Estimate 2022-01-01 | |
|---|---|---|---|---|---|---|---|
| Lejre | Municipality | 26,132 | 26,764 | 27,317 | 28,173 | 28,623 | → |
| Sjælland [Zealand] | Region | 811,511 | 819,763 | 827,499 | 838,840 | 843,513 |
Contents: Urban Settlements
The population development of the urban settlements in Lejre.
| Name | Status | Municipality | Population Estimate 2006-01-01 | Population Estimate 2011-01-01 | Population Estimate 2016-01-01 | Population Estimate 2021-01-01 | Population Estimate 2022-01-01 | |
|---|---|---|---|---|---|---|---|---|
| Ejby | Urban Settlement | Lejre | 1,922 | 1,876 | 1,935 | 1,957 | 1,978 | → |
| Englerup | Urban Settlement | Lejre | 305 | 316 | 305 | 291 | 291 | → |
| Gershøj | Urban Settlement | Lejre | 716 | 688 | 669 | 708 | 697 | → |
| Gevninge | Urban Settlement | Lejre | 1,384 | 1,711 | 1,685 | 1,662 | 1,649 | → |
| Gøderup | Urban Settlement | Lejre | ... | ... | ... | 211 | 204 | → |
| Herslev | Urban Settlement | Lejre | 229 | 209 | 222 | 221 | 220 | → |
| Kirke Hvalsø | Urban Settlement | Lejre | 3,742 | 3,941 | 4,119 | 4,222 | 4,294 | → |
| Kirke Hyllinge | Urban Settlement | Lejre | 1,842 | 1,984 | 2,127 | 2,228 | 2,289 | → |
| Kirke Såby | Urban Settlement | Lejre | 1,733 | 1,676 | 1,696 | 1,702 | 1,651 | → |
| Kirke Sonnerup | Urban Settlement | Lejre | 999 | 965 | 945 | 956 | 928 | → |
| Kyndeløse Sydmark | Cottage Settlement | Lejre | 473 | 456 | 450 | 516 | 517 | → |
| Lejre | Urban Settlement | Lejre | 2,203 | 2,343 | 2,382 | 2,834 | 3,127 | → |
| Lindenborg | Urban Settlement | Lejre | ... | 201 | 207 | 218 | 253 | → |
| Lyndby | Urban Settlement | Lejre | 505 | 561 | 559 | 559 | 560 | → |
| Øm | Urban Settlement | Lejre | 443 | 470 | 477 | 448 | 451 | → |
| Osted | Urban Settlement | Lejre | 2,014 | 2,073 | 2,156 | 2,172 | 2,204 | → |
| Sæby | Urban Settlement | Lejre | 337 | 341 | 357 | 333 | 332 | → |
| Torkilstrup | Urban Settlement | Lejre | 260 | 253 | 248 | 247 | 232 | → |
| Vester Såby | Urban Settlement | Lejre | 510 | 494 | 467 | 463 | 450 | → |
Source: Denmark Statistik (web).