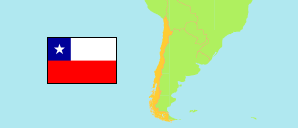
Los Lagos
Region in Chile
Contents: Subdivision
The population development in Los Lagos as well as related information and services (Wikipedia, Google, images).
| Name | Status | Population Estimate 2002-07-01 | Population Estimate 2007-07-01 | Population Estimate 2012-07-01 | Population Estimate 2017-07-01 | Population Projection 2023-07-01 | |
|---|---|---|---|---|---|---|---|
| Los Lagos | Region | 742,689 | 788,306 | 834,466 | 870,227 | 907,429 | |
| Chiloé | Province | 160,342 | 167,655 | 174,034 | 178,342 | 183,347 | → |
| Llanquihue | Province | 332,820 | 367,329 | 400,812 | 428,074 | 455,001 | → |
| Osorno | Province | 230,086 | 234,939 | 241,017 | 244,903 | 249,728 | → |
| Palena | Province | 19,441 | 18,383 | 18,603 | 18,908 | 19,353 | → |
| Chile | Republic | 15,691,701 | 16,517,933 | 17,443,491 | 18,419,192 | 19,960,889 |
Source: Instituto Nacional de Estadísticas.
Explanation: All tabulated population figures consider the results of the 2017 census.
Further information about the population structure:
| Gender (P 2023) | |
|---|---|
| Males | 451,199 |
| Females | 456,230 |
| Age Groups (P 2023) | |
|---|---|
| 0-17 years | 204,638 |
| 18-64 years | 580,102 |
| 65+ years | 122,689 |
| Age Distribution (P 2023) | |
|---|---|
| 80+ years | 29,113 |
| 70-79 years | 52,546 |
| 60-69 years | 90,253 |
| 50-59 years | 121,845 |
| 40-49 years | 130,865 |
| 30-39 years | 137,921 |
| 20-29 years | 117,903 |
| 10-19 years | 120,370 |
| 0-9 years | 106,613 |
| Urbanization (C 2017) | |
|---|---|
| Rural | 218,675 |
| Urban | 610,033 |
| Country of Birth (C 2017) | |
|---|---|
| Chile | 818,685 |
| South America | 7,603 |
| Central America & Caribbean | 601 |
| North America | 320 |
| Europe | 1,030 |
| Other country & undeclared | 469 |