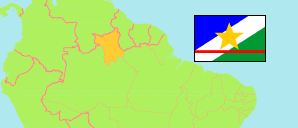
State
The population development of the State of Roraima according to census results and latest official population estimates.
| Name | Abbr. | Status | Capital | Area A (km²) | Population Census (Cf) 1991-09-01 | Population Census (Cf) 2000-08-01 | Population Census (Cf) 2010-08-01 | Population Census (C) 2022-08-01 | Population Estimate (E) 2025-07-01 | ||
|---|---|---|---|---|---|---|---|---|---|---|---|
| Roraima | RR | FSt | Boa Vista | 223,645 | 217,583 | 324,397 | 450,479 | 636,707 | 738,772 | 22364500 | → |
| Brazil | BRA | Fed Rep | Brasília | 8,510,418 | 146,825,475 | 169,799,170 | 190,755,799 | 203,080,756 | 213,421,037 |
- The population estimates for 2025 are based on adjusted results of the 2010 and 2022 census.
- Instituto Brasileiro de Geografia e Estatistica.
Contents: Cities & Towns
The population of all cities and towns in the State of Roraima with more than 5,000 inhabitants according to census results and latest calculations.
The listed places consist of the urban areas of one or more municipal districts of one municipality. In the case of several districts, their urban areas form (more or less) a conurbation.
| Name | Population Census (Cf) 2000-08-01 | Population Census (Cf) 2010-08-01 | Population Census (C) 2022-08-01 | Population Calculation (UE-E) 2025-07-01 | Area | |
|---|---|---|---|---|---|---|
| Alto Alegre | 5,195 | 4,780 | 4,763 | 5,330 | 308 | → |
| Boa Vista | 197,098 | 277,799 | 402,169 | 472,190 | 15050 | → |
| Bonfim | 3,000 | 3,711 | 5,067 | 5,670 | 1067 | → |
| Cantá | 1,155 | 2,257 | 4,628 | 5,230 | 927 | → |
| Caracaraí | 8,236 | 10,910 | 11,113 | 12,060 | 738 | → |
| Caroebe | 1,977 | 3,324 | 4,945 | 5,570 | 328 | → |
| Mucajaí | 7,029 | 8,935 | 10,121 | 11,190 | 960 | → |
| Pacaraima | 2,760 | 4,514 | 9,251 | 11,080 | 542 | → |
| Rorainópolis | 7,185 | 10,673 | 24,295 | 28,120 | 2370 | → |
| São João da Baliza | 3,882 | 4,755 | 6,287 | 7,080 | 417 | → |
- The urban population for 2025 is calculated by »City Population« using the urban population according to the 2022 census and latest official population estimates for the total municipality that are based on adjusted results of the 2010 and 2022 census.
- Instituto Brasileiro de Geografia e Estatistica.
Population Structure
Further information about the population structure.
| Gender (C 2022) | |
|---|---|
| Males | 320,392 |
| Females | 316,315 |
| Age Groups (C 2022) | |
|---|---|
| 0-14 years | 186,208 |
| 15-64 years | 418,124 |
| 65+ years | 32,375 |
| Age Distribution (C 2022) | |
|---|---|
| 90+ years | 843 |
| 80-89 years | 4,371 |
| 70-79 years | 13,779 |
| 60-69 years | 31,467 |
| 50-59 years | 51,855 |
| 40-49 years | 78,224 |
| 30-39 years | 98,674 |
| 20-29 years | 114,411 |
| 10-19 years | 115,088 |
| 0-9 years | 127,995 |
| Urbanization (C 2022) | |
|---|---|
| Rural | 138,937 |
| Urban | 497,770 |
| Ethnic Group (C 2022) | |
|---|---|
| Indigenous | 97,668 |
| Non-Indigenous | 539,039 |
| Color (C 2022) | |
|---|---|
| Black | 49,195 |
| White | 131,260 |
| Mixed / Other | 455,160 |
| Literacy (A15+) (C 2022) | |
|---|---|
| yes | 419,303 |
| no | 31,196 |
