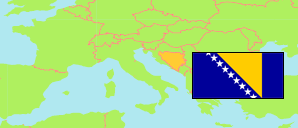
Šipovo
Municipality in Serb Republic
Municipality
The population development of Šipovo.
| Name | Native | Status | Population Census 1991-03-31 | Population Census 2013-10-01 | |
|---|---|---|---|---|---|
| Šipovo | Шипово | Municipality | 15,579 | 9,969 | → |
| Republika Srpska [Serb Republic] | Република Српска | Entity | 1,569,332 | 1,170,342 |
Contents: Settlements
The population development of the settlements in Šipovo.
| Name | Native | Status | Municipality | Population Census 1991-03-31 | Population Census 2013-10-01 | |
|---|---|---|---|---|---|---|
| Čifluk | Чифлук | Settlement | Šipovo | 680 | 682 | → |
| Donji Mujdžići | Доњи Мујџићи | Settlement | Šipovo | 169 | 200 | → |
| Lužine | Лужине | Settlement | Šipovo | 458 | 336 | → |
| Pribeljci | Прибељци | Settlement | Šipovo | 617 | 202 | → |
| Sarići | Сарићи | Settlement | Šipovo | 675 | 1,321 | → |
| Šipovo | Шипово | Urban Settlement | Šipovo | 5,170 | 3,749 | → |
| Todorići | Тодорићи | Settlement | Šipovo | 323 | 217 | → |
| Volari | Волари | Settlement | Šipovo | 576 | 240 | → |
| Vražić | Вражић | Settlement | Šipovo | 340 | 282 | → |
Source: Republika Srpska Institute of Statistics (web). Ethnic groups: Bosnia and Herzegovina Agency for Statistics (web).
Explanation: In case of the 2013 figures, the usually resident population is tabulated. In contrast, the ethnic group figures include also citizens of Bosnia and Herzegovina living and working abroad for many years.