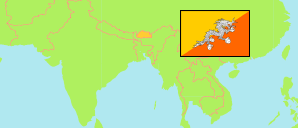
Paro
District in Bhutan
Contents: Subdivision
The population development in Paro as well as related information and services (Wikipedia, Google, images).
| Name | Status | Population Census 2005-05-31 | Population Census 2017-05-30 | |
|---|---|---|---|---|
| Paro | District | 35,260 | 46,316 | |
| Dokar (Doga) | Gewog | 1,866 | 2,327 | → |
| Dopshar-ri (Dopshari) | Gewog | 3,180 | 3,333 | → |
| Doteng | Gewog | 1,149 | 1,303 | → |
| Hoongrel (Hungrel) | Gewog | 1,250 | 336 | → |
| Lamgong | Gewog | 3,336 | 5,846 | → |
| Loong-nyi (Lungnyi) | Gewog | 2,543 | 4,727 | → |
| Nagya (Naja) | Gewog | 3,007 | 3,752 | → |
| Sharpa (Shapa) | Gewog | 4,319 | 5,941 | → |
| Tsento | Gewog | 5,253 | 5,946 | → |
| Wangchang | Gewog | 9,357 | 12,805 | → |
| Druk Yul [Bhutan] | Kingdom | 634,982 | 727,145 |
Source: National Statistics Bureau, Royal Government of Bhutan (web).
Explanation: The population figures of towns and municipalities are generally assigned to an adjacent gewog. Area figures of gewogs are computed by using geospatial data.
Further information about the population structure:
| Gender (C 2017) | |
|---|---|
| Males | 23,941 |
| Females | 22,375 |
| Age Groups (C 2017) | |
|---|---|
| 0-14 years | 11,406 |
| 15-64 years | 32,161 |
| 65+ years | 2,749 |
| Age Distribution (C 2017) | |
|---|---|
| 0-9 years | 7,523 |
| 10-19 years | 8,289 |
| 20-29 years | 11,071 |
| 30-39 years | 7,732 |
| 40-49 years | 4,550 |
| 50-59 years | 3,175 |
| 60-69 years | 2,148 |
| 70+ years | 1,828 |
| Urbanization (C 2017) | |
|---|---|
| Rural | 34,403 |
| Urban | 11,913 |