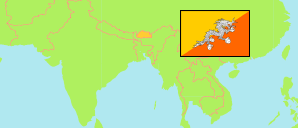
Mongar
District in Bhutan
Contents: Subdivision
The population development in Mongar as well as related information and services (Wikipedia, Google, images).
| Name | Status | Population Census 2005-05-31 | Population Census 2017-05-30 | |
|---|---|---|---|---|
| Mongar (Monggar) | District | 37,069 | 37,150 | |
| Balam | Gewog | 1,092 | 912 | → |
| Chagsakhar (Chaskhar) | Gewog | 2,376 | 2,494 | → |
| Chhaling (Chhali) | Gewog | 1,620 | 1,441 | → |
| Dramedtse (Drametse) | Gewog | 2,130 | 1,848 | → |
| Drepoong (Drepung) | Gewog | 1,094 | 904 | → |
| Gongdue | Gewog | 1,329 | 1,234 | → |
| Jurmed (Jurmey) | Gewog | 1,449 | 1,247 | → |
| Kengkhar | Gewog | 1,996 | 1,844 | → |
| Monggar (Mongar) | Gewog | 9,214 | 11,130 | → |
| Na-Rang (Narang) | Gewog | 1,780 | 2,232 | → |
| Ngatshang | Gewog | 2,109 | 2,375 | → |
| Saling (Saleng) | Gewog | 2,929 | 2,881 | → |
| Shermuhoong (Shermung) | Gewog | 1,830 | 1,627 | → |
| Silambi | Gewog | 1,458 | 1,357 | → |
| Thang-Rong (Thangrong) | Gewog | 1,863 | 1,606 | → |
| Tsakaling | Gewog | 1,596 | 1,086 | → |
| Tsamang | Gewog | 1,204 | 932 | → |
| Druk Yul [Bhutan] | Kingdom | 634,982 | 727,145 |
Source: National Statistics Bureau, Royal Government of Bhutan (web).
Explanation: The population figures of towns and municipalities are generally assigned to an adjacent gewog. Area figures of gewogs are computed by using geospatial data.
Further information about the population structure:
| Gender (C 2017) | |
|---|---|
| Males | 18,247 |
| Females | 18,903 |
| Age Groups (C 2017) | |
|---|---|
| 0-14 years | 11,399 |
| 15-64 years | 23,108 |
| 65+ years | 2,643 |
| Age Distribution (C 2017) | |
|---|---|
| 0-9 years | 7,257 |
| 10-19 years | 7,844 |
| 20-29 years | 5,833 |
| 30-39 years | 5,495 |
| 40-49 years | 3,844 |
| 50-59 years | 2,910 |
| 60-69 years | 2,162 |
| 70+ years | 1,805 |
| Urbanization (C 2017) | |
|---|---|
| Rural | 26,853 |
| Urban | 10,297 |