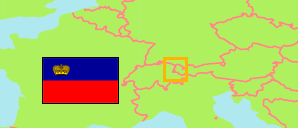
Districts
The population of the electoral districts of Liechtenstein according to census results and latest official estimates.
| Name | Abbr. | Area A (hect) | Population Census (C) 1980-12-02 | Population Census (C) 1990-12-04 | Population Census (C) 2000-12-05 | Population Census (C) 2010-12-31 | Population Census (C) 2020-12-31 | Population Estimate (Ep) 2024-12-31 | ||
|---|---|---|---|---|---|---|---|---|---|---|
| Oberland [Upper Country] | OL | 12,550 | 17,691 | 19,875 | 22,278 | 23,315 | 24,909 | 26,029 | 12550 | |
| Unterland [Lower Country] | UL | 3,500 | 7,524 | 9,157 | 11,029 | 12,834 | 14,146 | 14,871 | 3500 | |
| Liechtenstein | LIE | 16,050 | 25,215 | 29,032 | 33,307 | 36,149 | 39,055 | 40,900 |
- In 2010 and 2020, register-based censuses were performed. Starting in 2024, a new population definition is used. The total end-of-2024 population would be 885 lower under the old definition.
- Amt für Statistik, Fürstentum Liechtenstein.
Major Communes
| Name | Adm. | Population Estimate (Ep) 2024-12-31 | |
|---|---|---|---|
| 1 | Schaan | OL | 6,290 |
| 2 | Vaduz | OL | 6,031 |
| 3 | Triesen | OL | 5,705 |
| 4 | Balzers | OL | 4,806 |
| 5 | Eschen | UL | 4,735 |
| 6 | Mauren | UL | 4,632 |
| 7 | Triesenberg | OL | 2,706 |
| 8 | Ruggell | UL | 2,553 |
Contents: Communes
The population of the communes of Liechtenstein according to census results and latest official estimates.
| Name | Status | Adm. | Population Census (C) 1980-12-02 | Population Census (C) 1990-12-04 | Population Census (C) 2000-12-05 | Population Census (C) 2010-12-31 | Population Census (C) 2020-12-31 | Population Estimate (Ep) 2024-12-31 | Area |
|---|---|---|---|---|---|---|---|---|---|
| Balzers | Com | OL | 3,186 | 3,791 | 4,247 | 4,528 | 4,684 | 4,806 | 1962 |
| Eschen | Com | UL | 2,594 | 3,103 | 3,772 | 4,215 | 4,523 | 4,735 | 1033 |
| Gamprin | Com | UL | 777 | 989 | 1,210 | 1,606 | 1,686 | 1,782 | 614 |
| Mauren | Com | UL | 2,463 | 2,774 | 3,335 | 3,999 | 4,424 | 4,632 | 745 |
| Planken | Com | OL | 280 | 312 | 352 | 425 | 483 | 491 | 530 |
| Ruggell | Com | UL | 1,113 | 1,479 | 1,721 | 2,001 | 2,404 | 2,553 | 737 |
| Schaan | Com | OL | 4,551 | 5,036 | 5,574 | 5,767 | 6,037 | 6,290 | 2685 |
| Schellenberg | Com | UL | 577 | 812 | 991 | 1,013 | 1,109 | 1,169 | 355 |
| Triesen | Com | OL | 2,970 | 3,543 | 4,424 | 4,826 | 5,330 | 5,705 | 2635 |
| Triesenberg | Com | OL | 2,098 | 2,296 | 2,636 | 2,562 | 2,634 | 2,706 | 2977 |
| Vaduz | Com | OL | 4,606 | 4,897 | 5,045 | 5,207 | 5,741 | 6,031 | 1728 |
- In 2010 and 2020, register-based censuses were performed. Starting in 2024, a new population definition is used. The end-of-2024 populations of Vaduz, Schaan and Triesen would be 205, 181 and 173 lower, respectively, under the old definition.
- Amt für Statistik, Fürstentum Liechtenstein.
Population Structure
Further information about the population structure.
| Gender (E 2023) | |
|---|---|
| Males | 20,043 |
| Females | 20,414 |
| Citizenship (E 2024) | |
|---|---|
| Liechtenstein | 26,516 |
| Switzerland | 3,877 |
| Austria | 2,384 |
| Germany | 1,950 |
| Other Citizenship | 6,173 |
